Content
Published:
This is an archived release.
Moderate decline in employment
Norwegian industrial managers experienced additional growth in total output. A further increase in new orders from export markets explains this rise. The growth in demand was not sufficient to prevent a decline in total employment.
| 2nd quarter 2014 | ||
|---|---|---|
| Changes from previous quarter | Expected changes in next quarter | |
| 1A diffusion index is compiled using the estimated percentages on "ups" and "same" according to the formula: (ups + 0,5 * same). The diffusion index has a turning point at 50. An index value above 50 indicates growth in the variable, and opposite for a value below 50. | ||
| Total volume of production | 53.5 | 56.4 |
| Average capacity utilisation | 52.7 | 55.2 |
| Average employment | 48.4 | 48.0 |
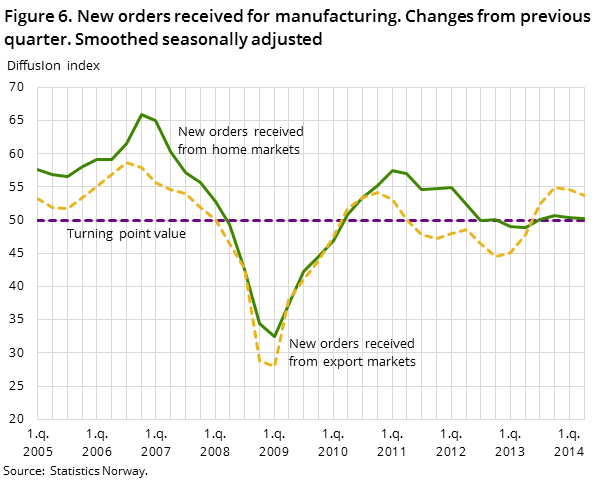
| New orders received from home markets | 50.2 | 53.2 |
| New orders received from export markets | 53.4 | 54.2 |
| Total stock of orders | 53.6 | 53.1 |
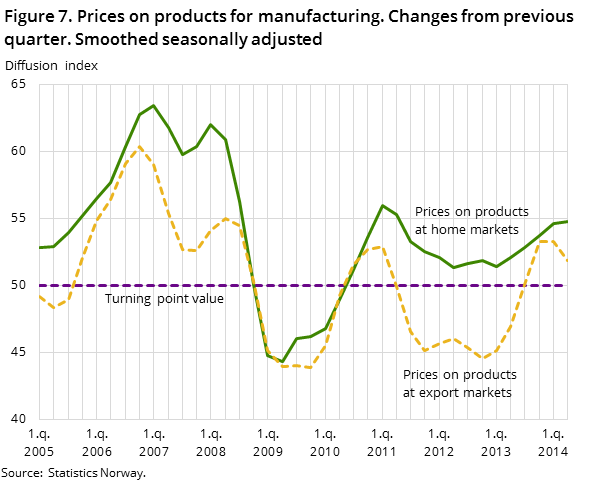
| Prices on products at home markets | 54.9 | 55.8 |
| Prices on products at export markets | 51.8 | 51.4 |
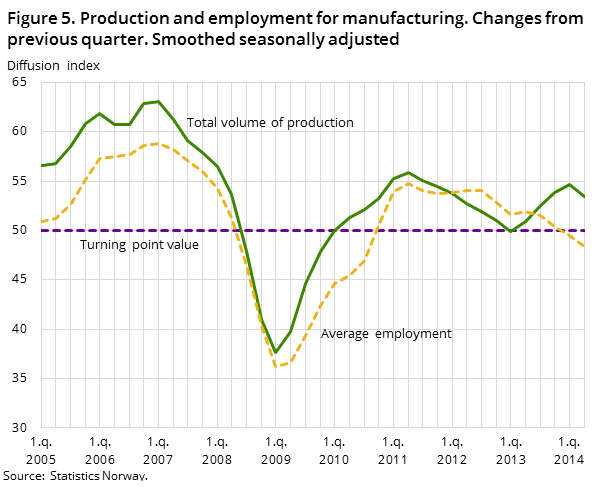
The Business tendency survey for the second quarter of 2014 shows a further increase in total output. Higher volumes within many industries explain this fact. The improvement was particularly strong within manufacturing of machinery and equipment, computer and electrical equipment, basic chemicals and basic metals. Only a few industries experienced a decline in production, the most important of which was building of ships, boats and oil platforms. Total employment was lower than in the first quarter of 2014. The demand for skilled labour within manufacturing of capital goods has more or less ceased to grow and can no longer compensate for fewer employees within manufacturing of intermediate goods and consumer goods .
Higher demand and improved prices in export markets
Total stocks continued to rise in the second quarter of 2014. Higher volumes of new orders and improved prices in export markets explain this growth. The increase in demand was particularly strong for producers of machinery and equipment, paper and paper products, basic chemicals and non-ferrous metals. The supply of new orders in home markets has remained unchanged in four consecutive quarters, but market prices improved during the same period. Domestic demand for capital goods continued to fall, and the supply of new orders was particularly poor within building of ships, boats and oil platforms. Higher demand for intermediate goods and consumer goods compensated for this decline.
Mixed expectations for the third quarter
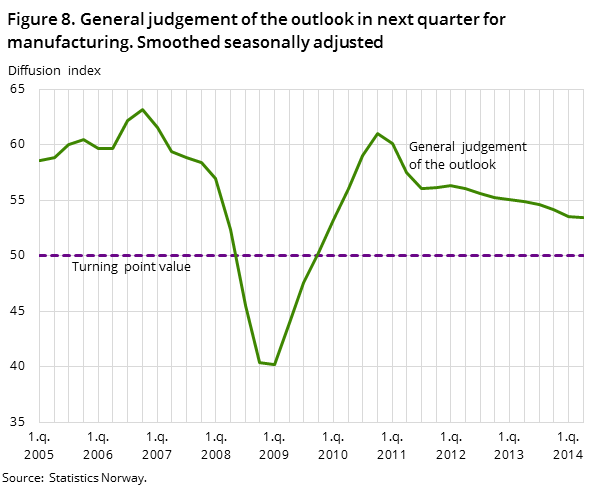
The general outlook for the third quarter of 2014 is considered to be positive. The strongest optimism was recorded within manufacturing of export goods and among producers of food and beverages. Producers of capital goods had negative expectations for the third quarter. Prospects of a decline in new orders from oil and gas activities might explain this fact.
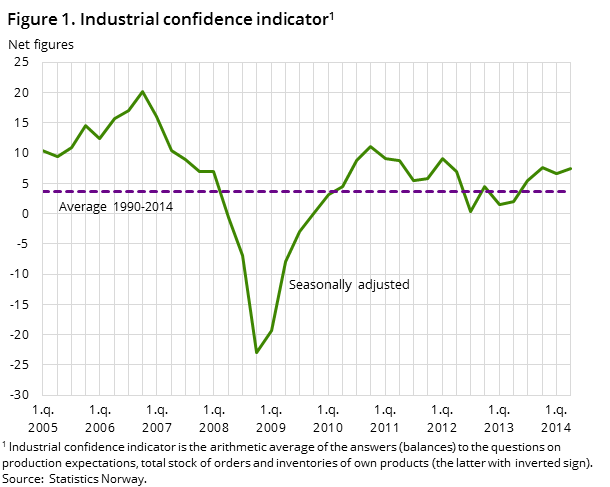
The industrial confidence indicator rose from 7 to 8 (seasonally-adjusted net figure) in the second quarter of 2014. Higher total stocks of orders and lower inventories of products intended for sale explain this growth. Values above zero indicate that total output will grow, while values below zero indicate that total output will fall. International comparisons of the industrial confidence indicator are available from Eurostat (EU), The Swedish National Institute of Economic Research and Statistics Denmark.
Improved capacity utilisation
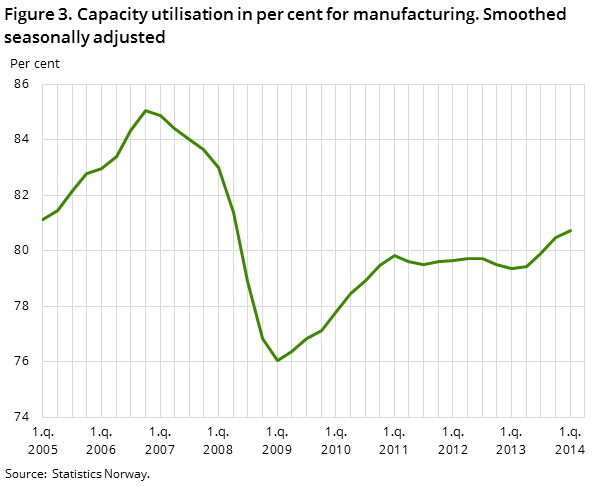
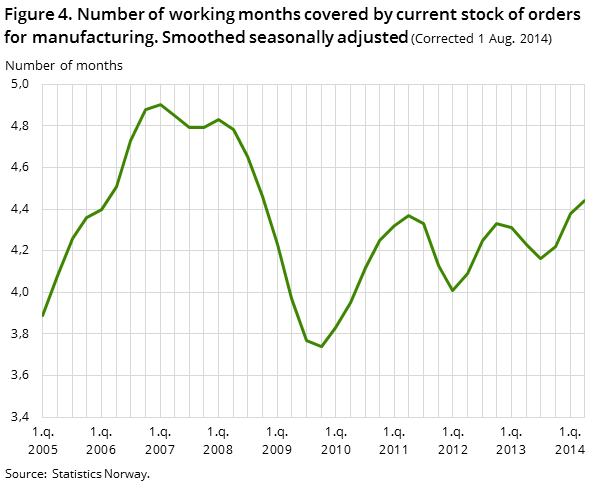
Average capacity utilisation for the Norwegian manufacturing industry is estimated at 80.7 per cent at the end of the second quarter of 2014. This is the highest result since 2008, but the figure lies below the historical average. International comparisons of average capacity utilisation are available from Eurostat (EU). The average number of working months covered by the current stock of orders was somewhat higher than in the corresponding quarter of 2013 and lay well above the historical average. The improvement was particularly strong within manufacturing of machinery and equipment.
Timeliness
The survey data was collected in the period from 10 June 2014 to 25 July 2014.
Assessment of industries in Q2 2014 and the short-term outlook 1
1 Prospects shows an overall evaluation of the present situation and expected short-term developments 2 Very good: ++, Good: +, Stable: ~, Poor: -, Very poor: --, Good, but with certain negative indications: +(-), A situation where the + and - factors even out: +/-, Poor, but with certain positive indications: -(+) | |
| Industry | Prospects 2 |
| Food, beverages and tobacco | + |
| Wood and wood products | +(-) |
| Paper and paper products | + |
| Basic chemicals | ++ |
| Non-ferrous metals | + |
| Fabricated metal products | + |
| Computer and electrical equipment | + |
| Machinery and equipment | + |
| Ships, boats and oil platforms | - |
| Repair, installation of machinery | +(-) |
Additional information
The statistics provide current data on the business cycle for manufacturing, mining and quarrying by collecting business leaders’ assessments of the economic situation and the short term outlook.
Contact
-
Edvard Andreassen
E-mail: edvard.andreassen@ssb.no
tel.: (+47) 40 90 23 32
-
Ståle Mæland
E-mail: stale.maeland@ssb.no
tel.: (+47) 95 05 98 88
